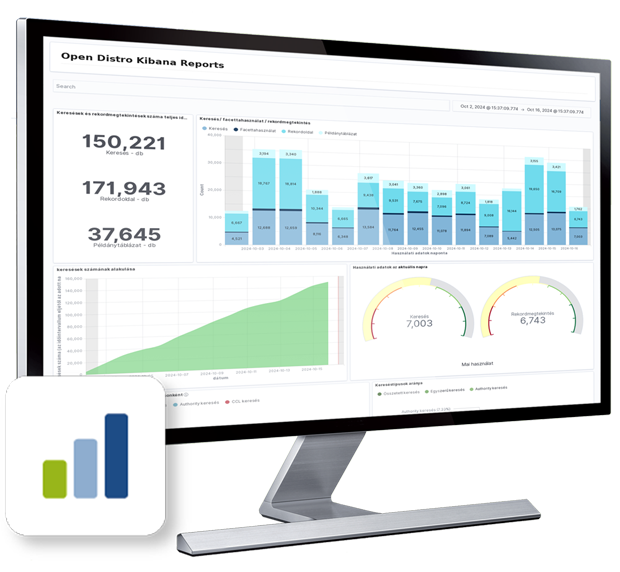
The Qulto STAT central web service enables our partner institutions using the Qulto product portfolio to produce up-to-date data visualisations from the statistical event log entries of the products they use to support their management decision making processes.
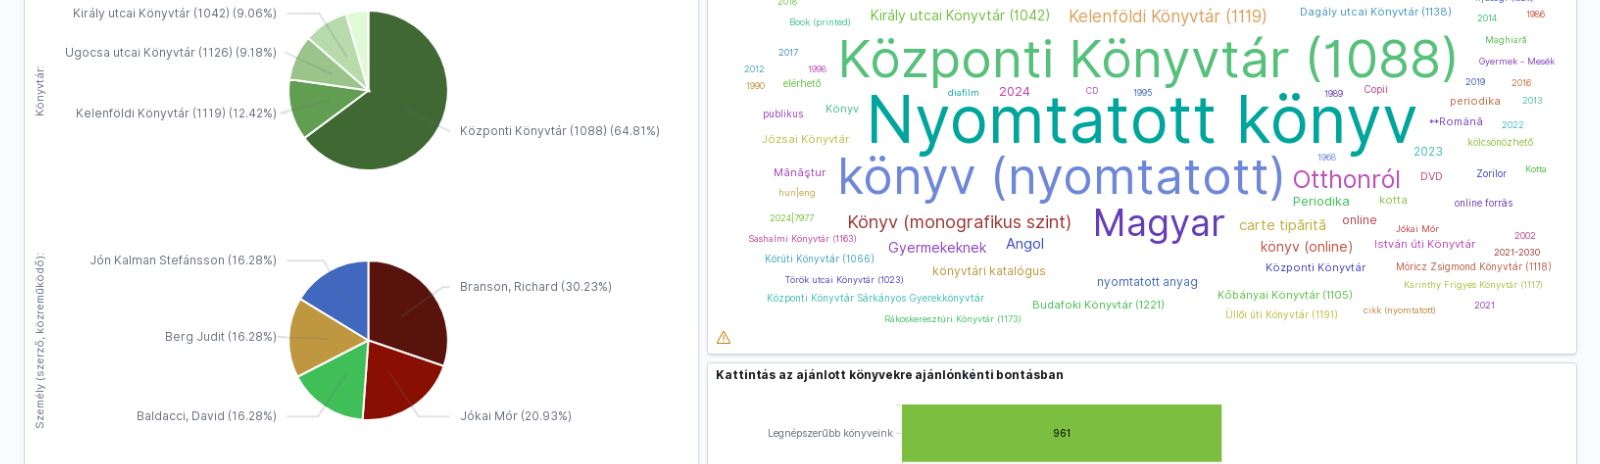
The service includes pre-compiled dashboard templates for each product, which contain data visualisations that help to track the most important usage processes, trends and correlations for the given products. These dashboard templates are immediately available to all institutions using Qulto Stat services, but it is also possible to customise them (to make minor or major changes to some data visualisations, to add data visualisations that are not yet on the dashboard but that show a process important for the institution). It is even possible to create a completely new dashboard (e.g. focusing on a specific aspect, function or process group) for Qulto Stat administrators with the appropriate rights.
For customising dashboards, data visualisations and creating new dashboards, the web application offers a graphical user interface, so no administrator or programming skills are required. However, in order to create data visualisations that illustrate processes and relationships well, a basic knowledge of log data, data structures, statistical concepts and data visualisation methods is required.
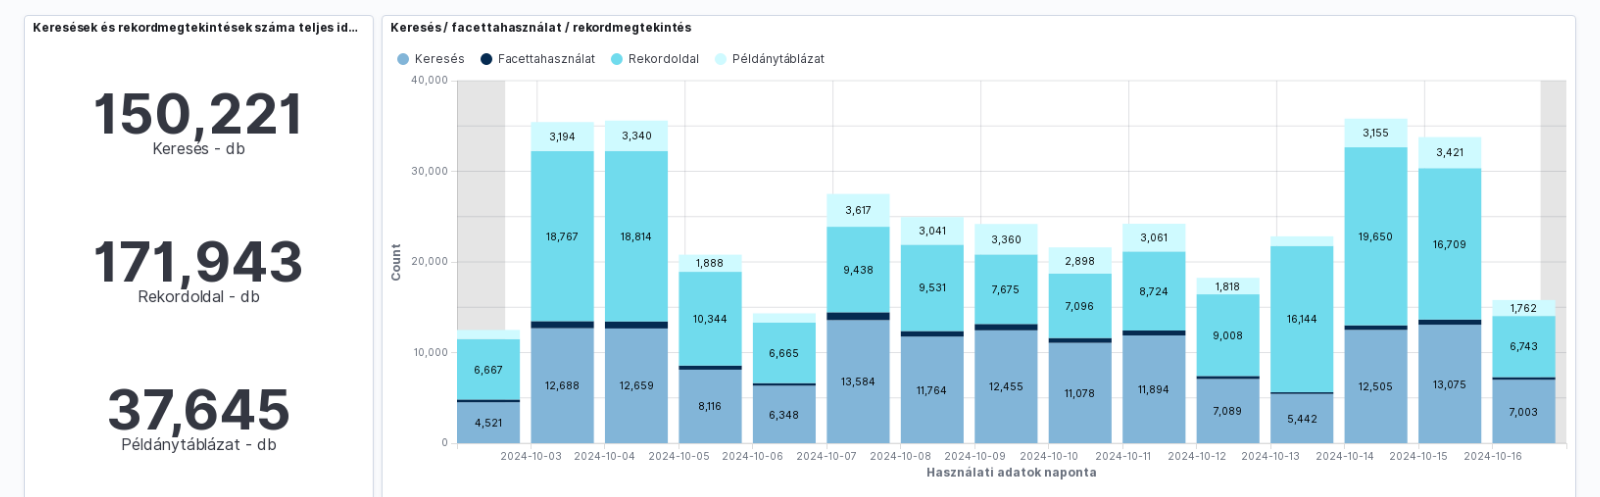
Data visualisations are based on statistical log event entries from Qulto products. The range of these log event entries is gradually expanding: more and more Qulto products are providing data to the central Qulto STAT service, and the data content of each log event entry is also gradually being enriched to help us to analyse trends and correlations with as much data as possible. The development of Qulto Stat in this direction is ongoing and scheduled.
Information
Qulto level(s) of ecosystem
Manage
Institutional level(s)
Libraries, Museums