
Ready-made dashboards
Pre-built data visualisation templates for each product.
A compass for collection decisions. Qulto DataCompass provides an integrated decision support platform, from statistical analysis to performance measurement. Connect your existing systems with the latest ROI calculator and future-proof, AI-powered predictive analytics, all in a single interface.
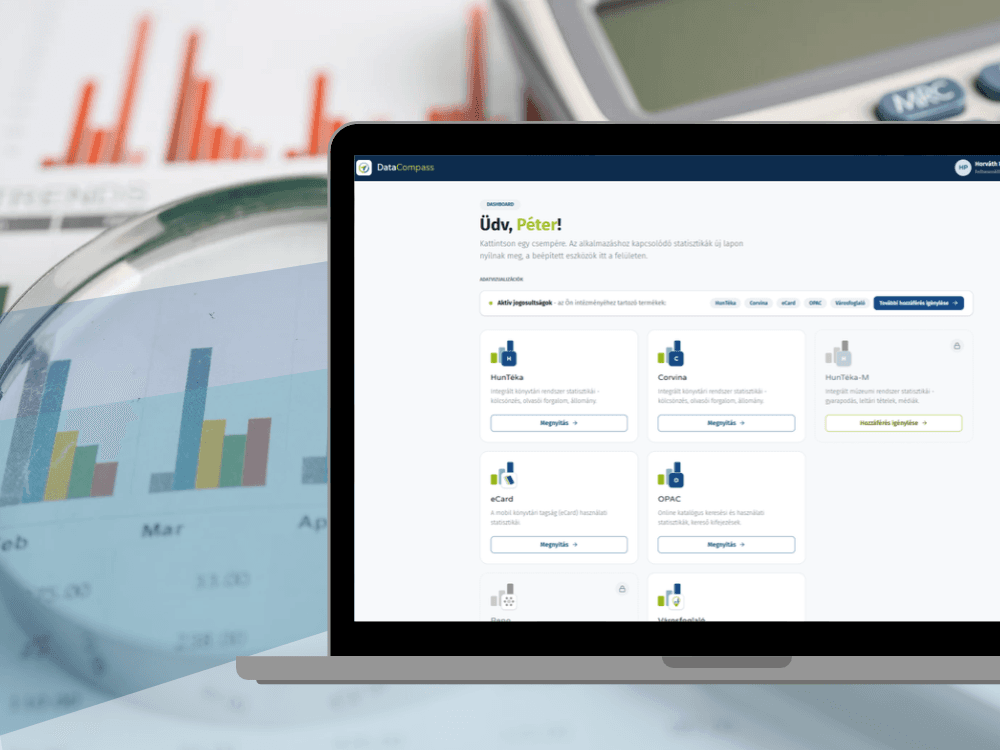

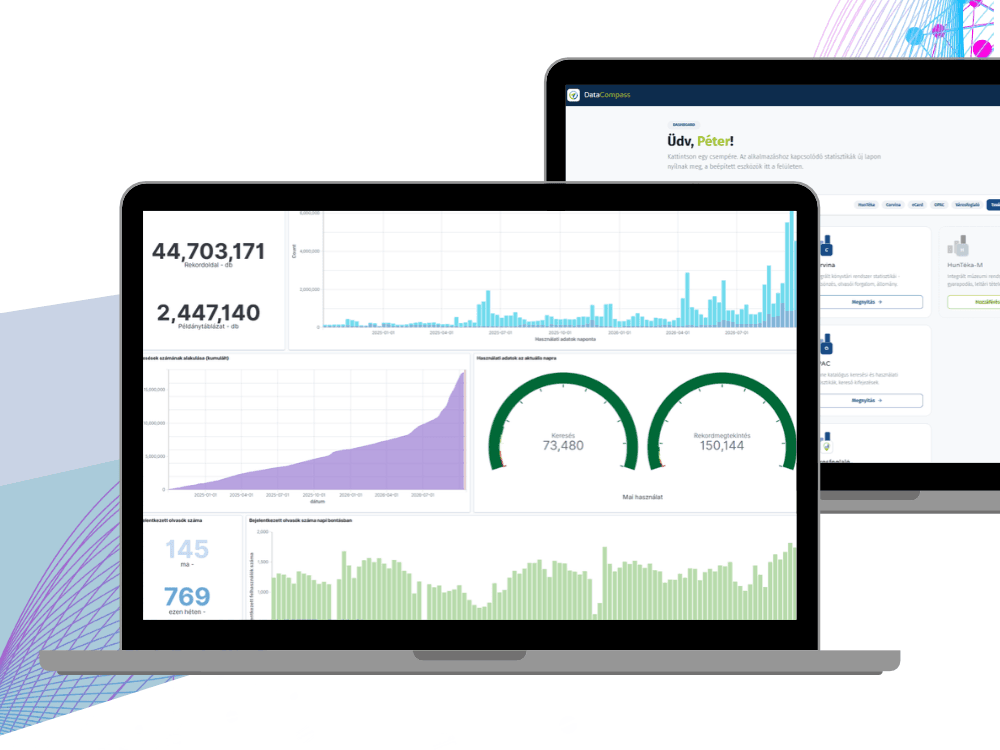
The DataCompass central web service enables partner institutions using the Qulto product portfolio to support management decision-making with data visualisations and trends built from the statistical event log entries of the products they use.
The service includes pre-built dashboard templates for each product, which are immediately available to every institution using DataCompass. Dashboards can also be customised, and entirely new dashboards can be created.
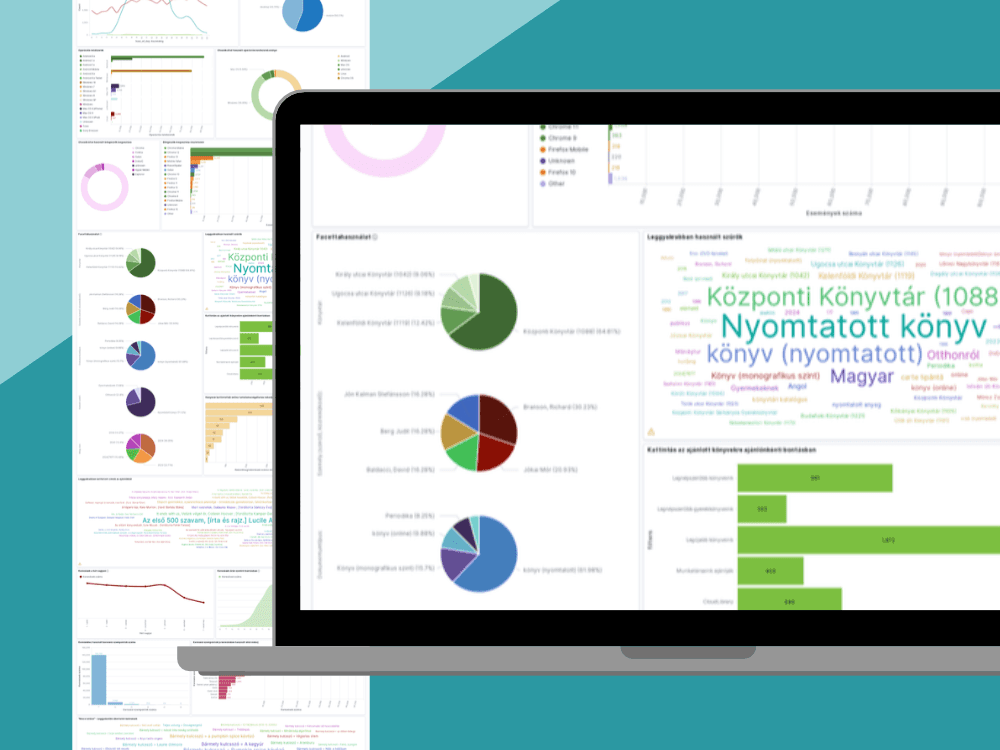
The service includes pre-built dashboard templates for each product, showing the most important usage processes, trends and correlations. These are immediately available to every institution.
Dashboards can be customised and extended, and entirely new dashboards focusing on a specific aspect can be created. The web application’s graphical interface requires no system administration or programming skills.
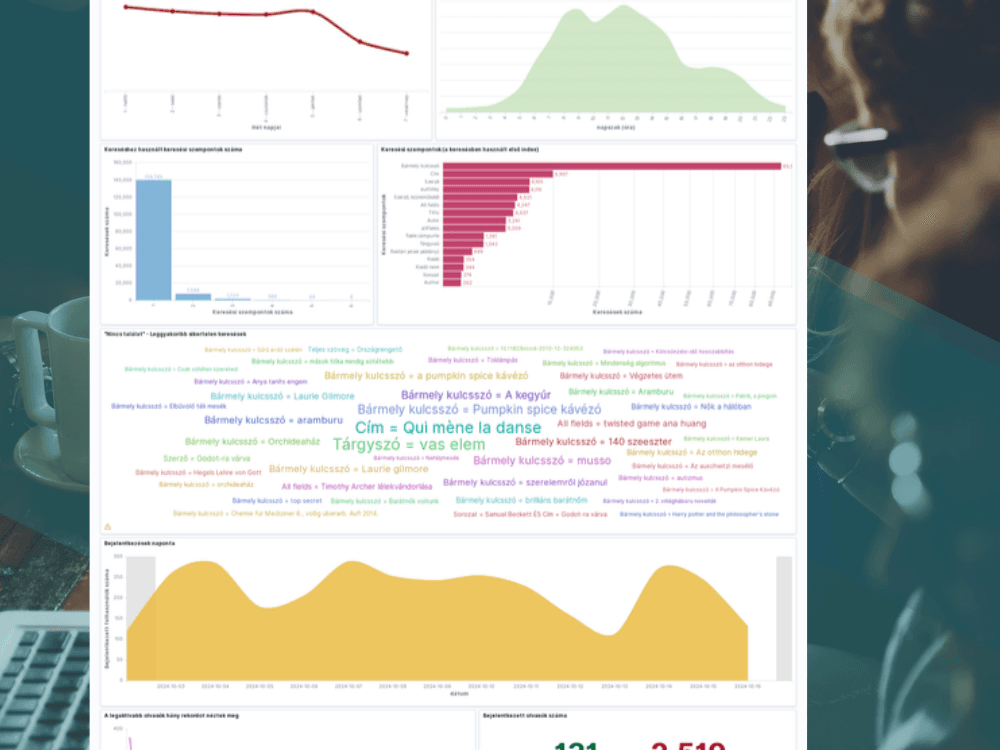
The data visualisations are based on statistical log event entries from Qulto products. The range is continuously expanding, with more and more products and ever richer data being connected.
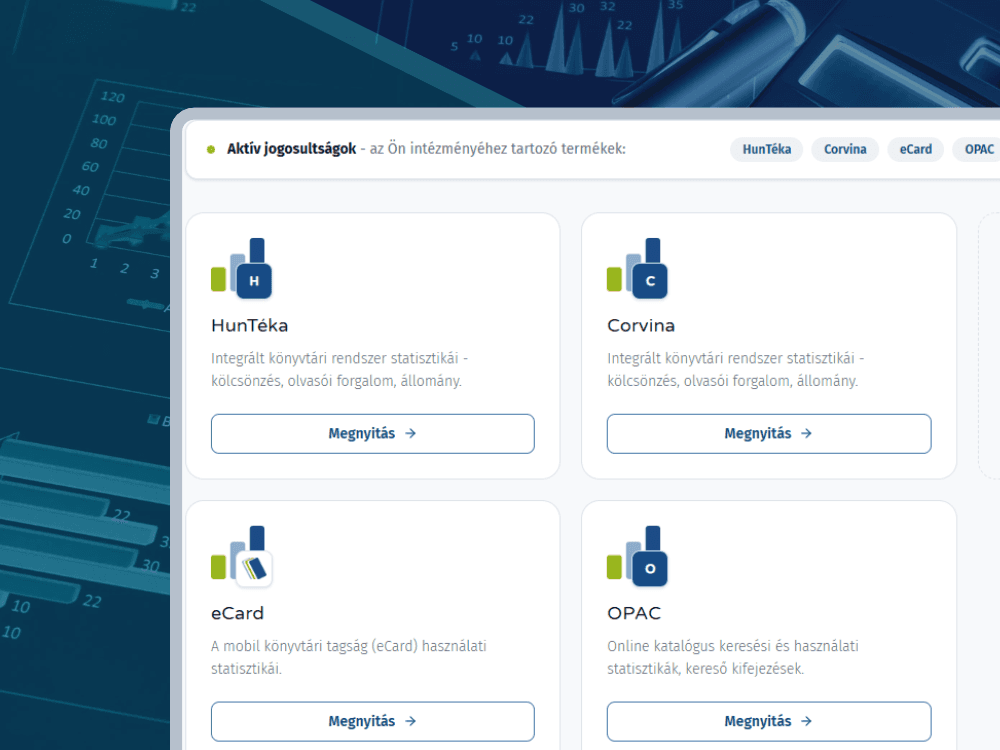
After a single, secure sign-on (SSO), users see the application tiles matching their permissions: HunTéka Stat, Corvina Stat, Városfoglaló Stat, eCard Stat and OPAC Stat, all in one interface and accessible with a single click.
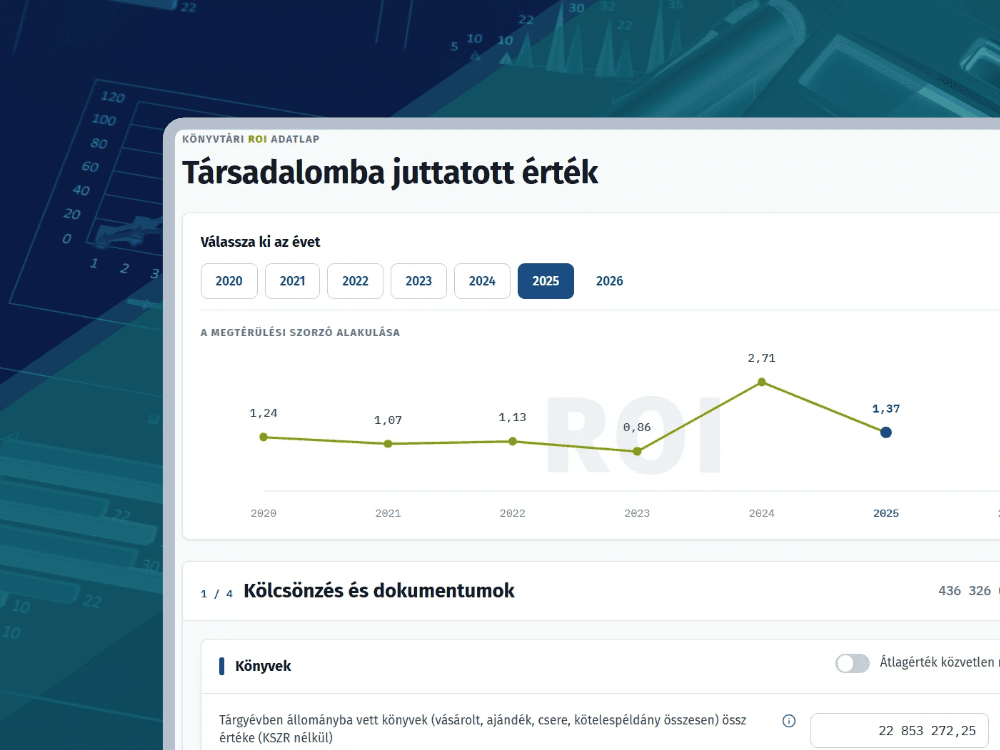
A built-in calculator for measuring the value the library delivers to society and its return on investment (ROI) multiplier, and for comparing multiple years. It is available to every library, regardless of its integrated library system.
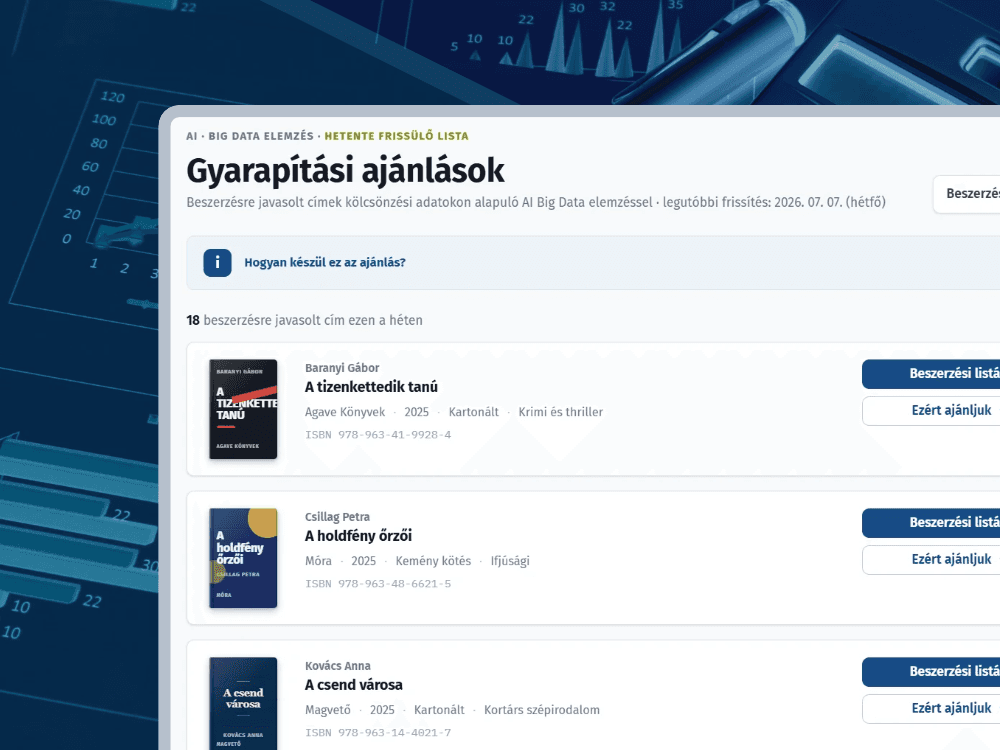
Big Data-based, AI-supported predictive analytics for identifying hidden patterns and reader and collection trends, enabling data-driven forecasts. We plan to activate this service in 2027.
Pre-built data visualisation templates for each product.
Dashboards and visualisations can be modified through a graphical interface.
Entirely new dashboards focusing on a specific process can be created.
The web application requires no system administration or programming skills.
Log event data from more and more Qulto products is being connected.
Up-to-date data to support management decision-making.
Secure SSO login, with all permitted applications in one place.
Per-product access control through an admin interface.
Statistical log event entries from Qulto products, a range that is continuously expanding.
Primarily libraries and museums that use the Qulto product portfolio.
Through unified, secure SSO login, with permissions managed by the Keycloak access management system.
No. The web application offers a graphical interface for customising dashboards and creating new data visualisations.
Yes. Existing visualisations can be modified and extended, and entirely new dashboards can be created.
The institution’s system administrator grants or revokes staff access for each application through an admin interface.
Our colleagues will gladly show you how the product works — leave your contact details and we will get in touch. Fields marked with an asterisk are required.